Quality Counts California
  • Skip to primary navigation
  • Skip to main content
  • Skip to primary sidebar
  • Skip to footer

Home   |   About   |   Contact

  • Home
  • Families
    • Overview
    • Quality: The Key to Education
    • How to Choose a Quality Program
    • Find Early Learning and Care Services
  • Child Care Providers
    • Overview of the Quality Process
    • Why Participate in QRIS
    • Get Started with Local QRIS
    • Family Engagement
      • Overview
      • Family Engagement Toolkit
        • Overview
        • Module 1: The What, Why, and How of Family Engagement
        • Module 2: Build Strengths-based Relationships
        • QCC Family Engagement Toolkit Contact and Support
        • Tips on How to Use the Simulations
        • Technical Requirements and Recommendations
    • County Program Profile and Services
  • Quality Partners
    • Overview
    • Consortium Members
      • Overview
      • About the QCC Consortium
      • Suggest Content for QCC
    • Coaches and Trainers
      • Overview
    • QRIS Assessors and Observers
      • Overview
    • Higher Education Faculty
      • Overview
    • County Program Profile and Services
    • Regional Hub Profiles
  • Policymakers
    • Overview
    • Impact
    • California QRIS Statistics
    • Media and Press
    • County Program Profile and Services
    • Regional Hub Profiles
  • About
    • Overview
    • Contact Us
    • Disclaimer

Home Policymakers California QRIS Statistics

California QRIS Statistics

Find statewide and national resources here with facts and compelling statistics on the impact of Quality Counts California on children, families, and early educators.

Chart illustrating QRIS participation from 2011 to 2019.

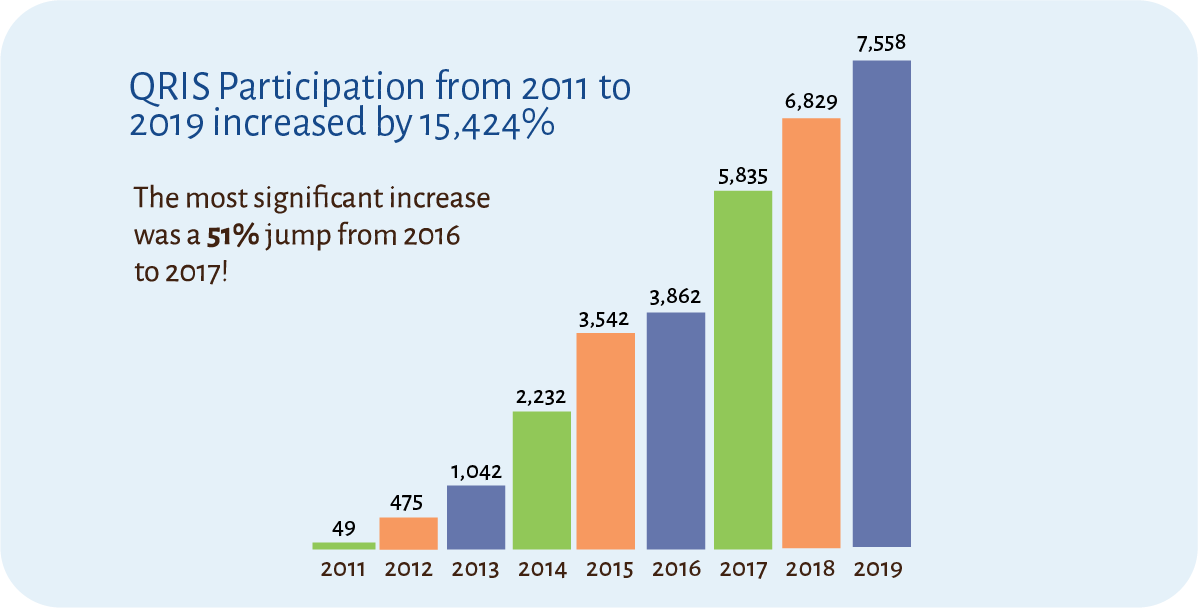
QRIS participation from 2011 to 2019 increased by 15,424%. The most significant increase was a 51% jump from 2016 to 2017!

  • 49 sites in 2011, grew
  • to 475 in 2012,
  • to 1,042 in 2013,
  • to 2,232 in 2014,
  • to 3,542 in 2015,
  • to 3,862 in 2016,
  • to 5,835 in 2017,
  • to 6,829 in 2018, and
  • to 7,558 in 2019

Chart illustrating the number of children being served by participating sites in fiscal year 2018-19.

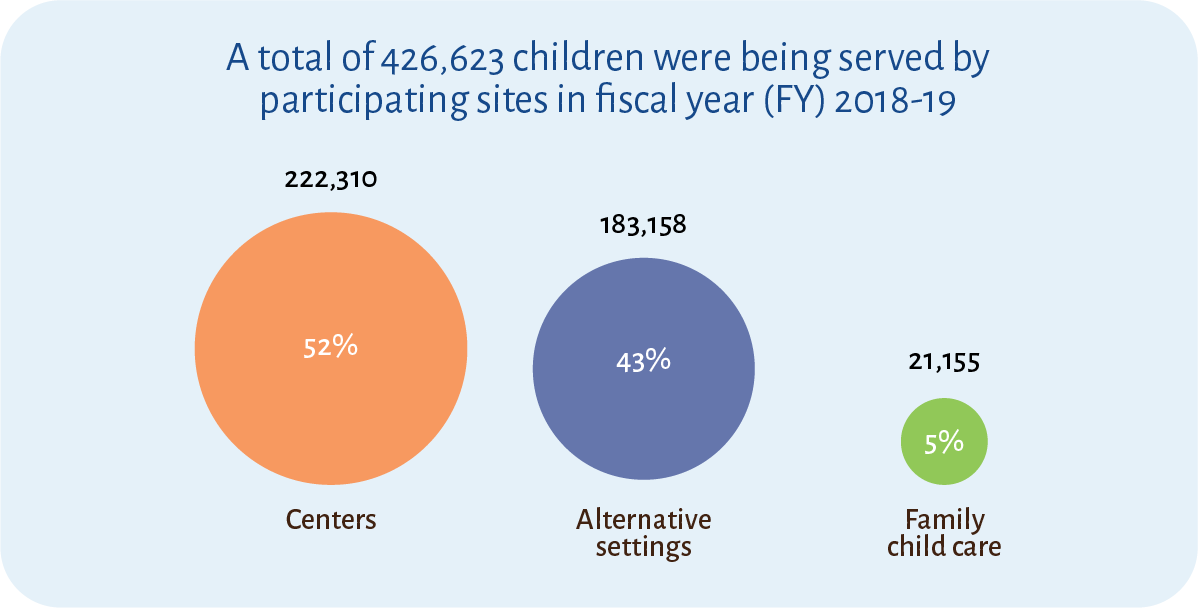
A total of 266,399 children were being served by participating sites in fiscal year (FY) 2018-19.

  • 222,310 children in centers
  • 183,158 children in alternative settings
  • 21,155 children in family child care

Chart illustrating the number of sites that participated in FY 2018-19 by Tier.

Distribution of the 5,061 sites that participated in FY 2018-19

  • 36 sites were at Tier 1
  • 723 sites were at Tier 2
  • 878 sites were at Tier 3
  • 2,451 sites were at Tier 4
  • 971 sites were at Tier 5

Chart that lists the number of sites by facility type that participated in FY 2018-19.

Sites by facility type in FY 2018-19

  • 4,114: centers
  • 2,691: family child care
  • 48: community-based organizations
  • 110: libraries
  • 78: home visiting programs
  • 300: family, friends, and neighbors
  • 29: playgroups
  • 78: family resource centers
  • 110: other

Chart illustrating selected site characteristics for participating sites in FY 2018-19.

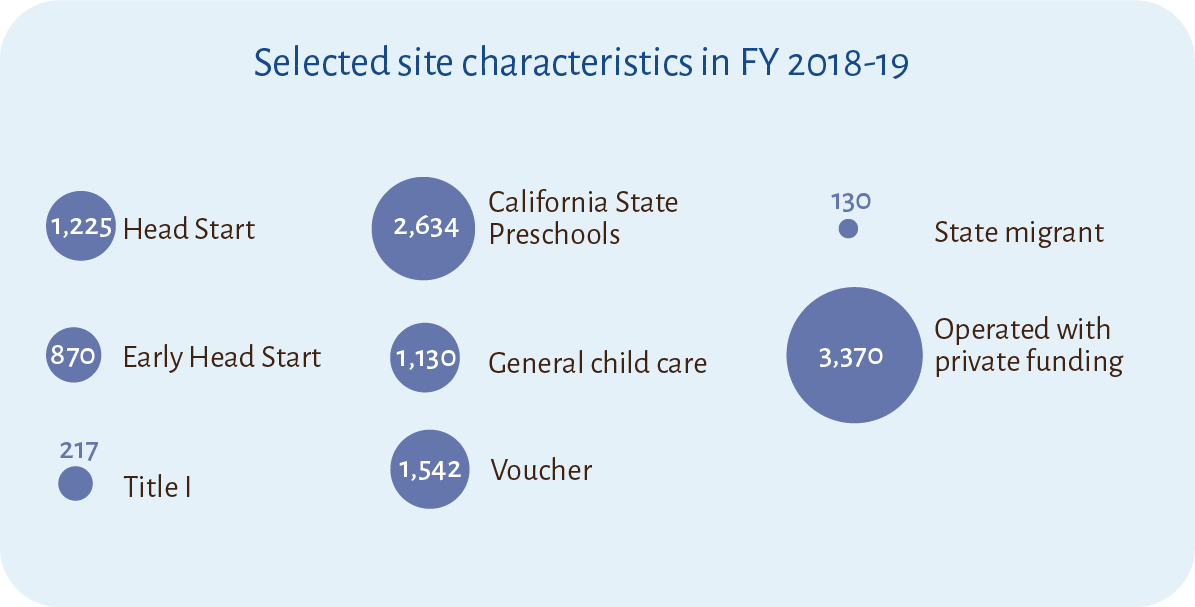
Selected site characteristics in FY 2018-19

  • 1,225: Head Start
  • 870: Early Head Start
  • 217: Title I
  • 2,634: California State Preschools
  • 1,130: General child care
  • 1,542: Voucher
  • 130: State migrant
  • 3,370: Operated with private funding

Primary Sidebar

In This Section

  • Overview
  • Impact
  • California QRIS Statistics
  • Media and Press
  • County Program Profile and Services
  • Regional Hub Profiles

Footer

  • Home
    • Search
  • About
    • About QCC
    • Contact Us
  • Families
    • Overview
    • Quality: The Key to Education
    • How to Choose a Quality Program
    • Find Early Learning and Care Services
  • Child Care Providers
    • Overview of the Quality Process
    • Why Participate in QRIS
    • Get Started with Local QRIS
    • Family Engagement
    • County Program Profile and Services
  • Quality Partners
    • Overview
    • Consortium Members
    • Coaches and Trainers
    • QRIS Assessors and Observers
    • Higher Education Faculty
    • County Program Profile and Services
    • Regional Hub Profiles
  • Policymakers
    • Overview
    • Impact
    • California QRIS Statistics
    • Media and Press
    • County Program Profile and Services
    • Regional Hub Profiles

Disclaimer   |   Copyright © 2023. Funded by First 5 California, in partnership with the California Department of Education and the California Department of Social Services.